Economy
|
Guatemala
|
| |
|
| Economy - overview |
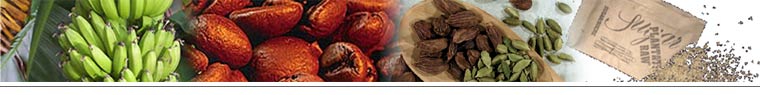
Guatemala is the largest and most populous of the Central American countries with a GDP per capita roughly one-half that of Brazil, Argentina, and Chile. The agricultural sector accounts for about one-fourth of GDP, two-thirds of exports, and half of the labor force. Coffee, sugar, and bananas are the main products. The 1996 signing of peace accords, which ended 36 years of civil war, removed a major obstacle to foreign investment, but widespread political violence and corruption scandals continue to dampen investor confidence. The distribution of income remains highly unequal, with perhaps 75% of the population below the poverty line. Ongoing challenges include increasing government revenues, negotiating further assistance from international donors, upgrading both government and private financial operations, curtailing drug trafficking, and narrowing the trade deficit. |
| GDP |
purchasing power parity - $56.53 billion (2003 est.) |
| GDP - real growth rate |
2.2% (2003 est.) |
| GDP - per capita |
purchasing power parity - $4,100 (2003 est.) |
| GDP - composition by sector |
agriculture: 22.5% |
| |
industry: 15% |
| |
services: 62.5% (2002 est.) |
| Population below poverty line |
75% (2002 est.) |
| Household income or consumption by percentage share |
lowest 10%: 1.6% |
| |
highest 10%: 46% (1998) |
| Distribution of family income - Gini index |
55.8 (1998) |
| Inflation rate (consumer prices) |
5.6% (2003 est.) |
| Labor force |
4.2 million (1999 est.) |
| Labor force - by occupation |
agriculture 50%, industry 15%, services 35% (1999 est.) |
| Unemployment rate |
7.5% (2003 est.) |
| Budget |
revenues: $2.3 billion |
| |
expenditures: $2.7 billion, including capital expenditures of $750 million (2002 est.) |
| Industries |
sugar, textiles and clothing, furniture, chemicals, petroleum, metals, rubber, tourism |
| Industrial production growth rate |
4.1% (1999) |
| Electricity - production |
6.237 billion kWh (2001) |
| Electricity - production by source |
fossil fuel: 51.9% |
| |
hydro: 35.2% |
| |
other: 12.9% (2001) |
| |
nuclear: 0% |
| Electricity - consumption |
5.559 billion kWh (2001) |
| Electricity - exports |
336 million kWh (2001) |
| Electricity - imports |
95 million kWh (2001) |
| Oil - production |
21,080 bbl/day (2001 est.) |
| Oil - consumption |
61,000 bbl/day (2001 est.) |
| Oil - exports |
NA |
| Oil - imports |
NA |
| Oil - proved reserves |
263 million bbl (1 January 2002) |
| Natural gas - proved reserves |
1.543 billion cu m (1 January 2002) |
| Agriculture - products |
sugarcane, corn, bananas, coffee, beans, cardamom. Cattle, sheep, pigs, chickens |
| Exports |
$2.763 billion f.o.b. (2003 est.) |
| Exports - commodities |
coffee, sugar, bananas, fruits and vegetables, cardamom, meat, apparel, petroleum, electricity |
| Exports - partners |
US 59%, El Salvador 9.4%, Nicaragua 3.2% (2002) |
| Imports |
$5.749 billion f.o.b. (2003 est.) |
| Imports - commodities |
fuels, machinery and transport equipment, construction materials, grain, fertilizers, electricity |
| Imports - partners |
US 34.3%, Mexico 8.6%, South Korea 8.4%, El Salvador 5.9%, China 4.1% (2002) |
| Debt - external |
$5.6 billion (2003 est.) |
| Economic aid - recipient |
$250 million (2000 est.) |
| Currency |
quetzal (GTQ), US dollar (USD), others allowed |
| Currency code |
GTQ, USD |
| Exchange rates |
quetzales per US dollar - 7.94 (2003), 7.82 (2002), 7.86 (2001), 7.76 (2000), 7.39 (1999) |
| Fiscal year |
calendar year |
| |
1 | 2 | 3 | 4 | 5 | 6 | 7 | 8
|